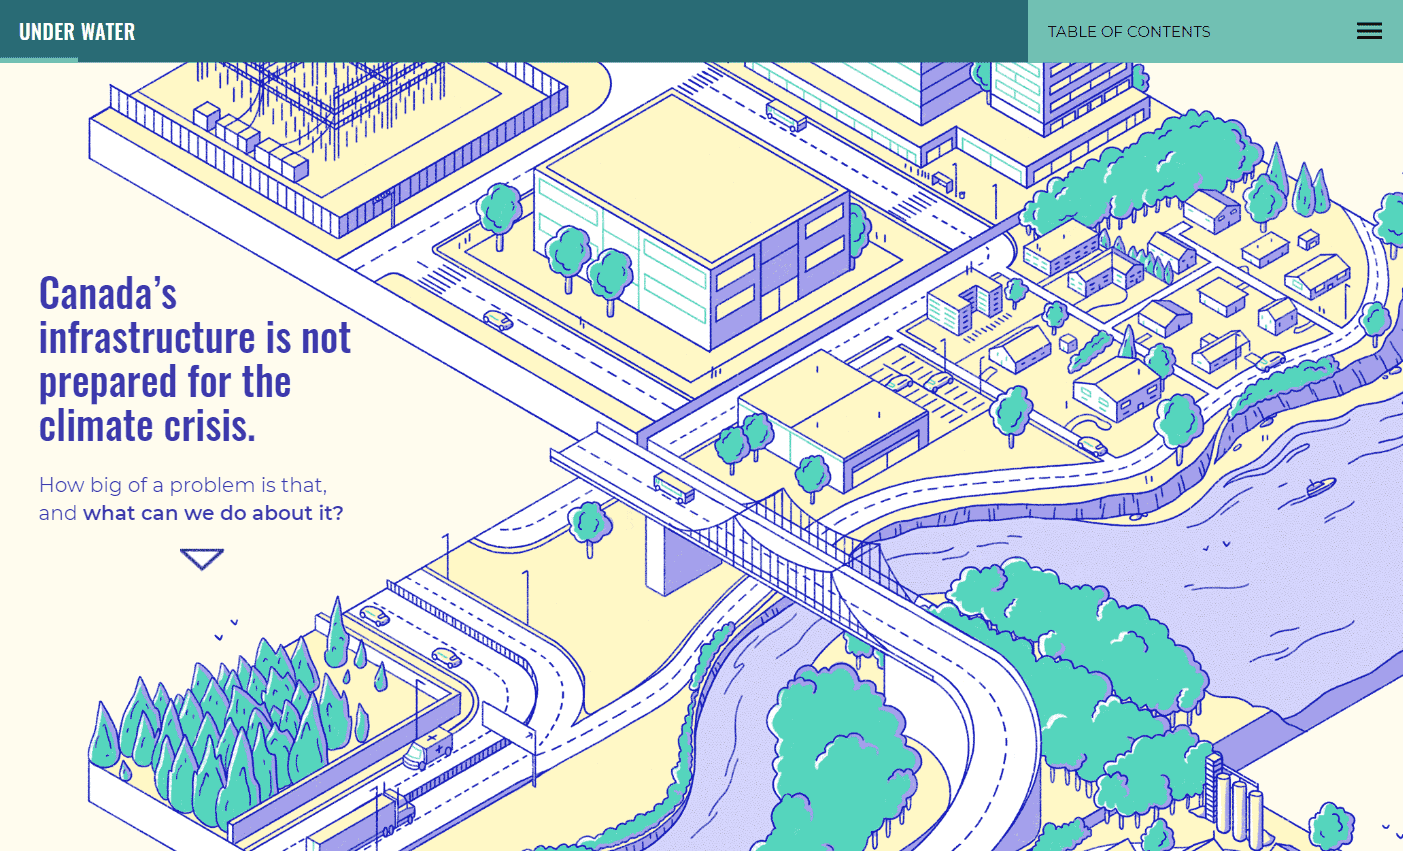
With the team at Voilà: Information Design— Estelle Villemin on illustrations, Chris Viau and myself on code, and Francis Gagnon and I on direction, I had the opportunity to work on a scrollytelling piece for the Canadian Institute for Climate Choices on their report on the costs of climate change on Canada's infrastructure.
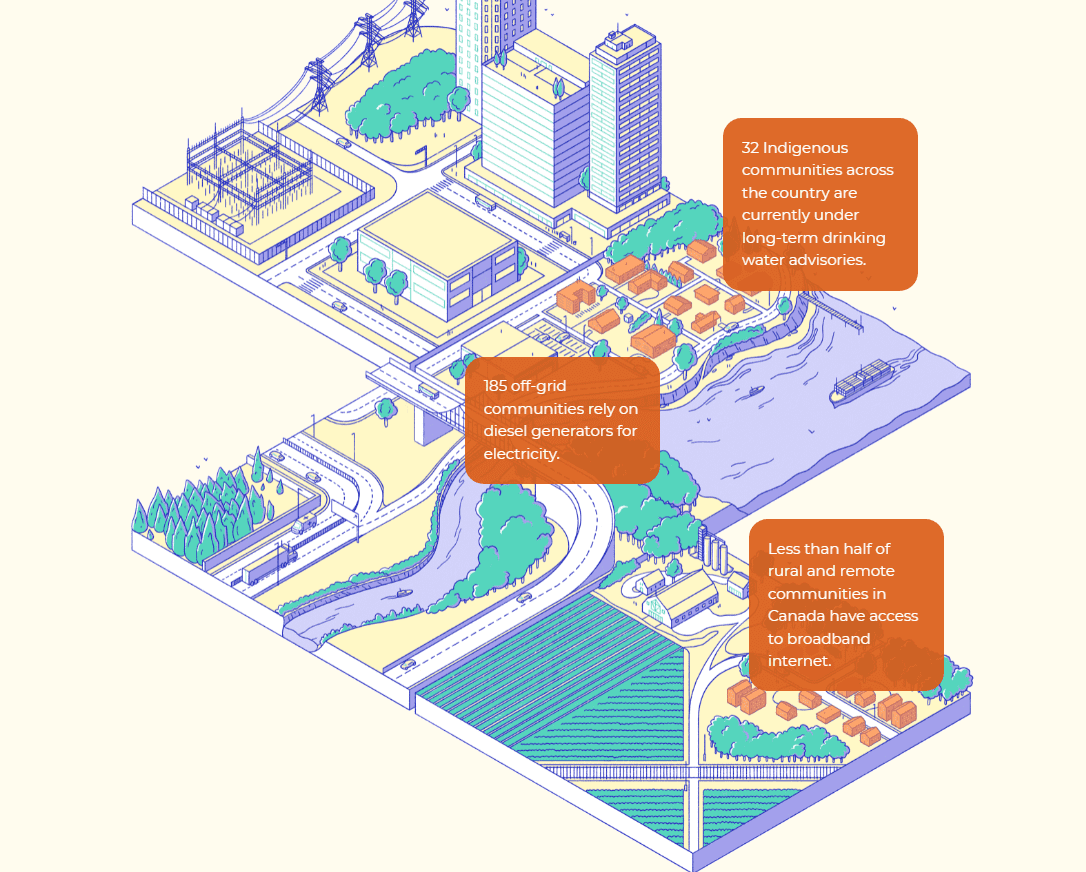
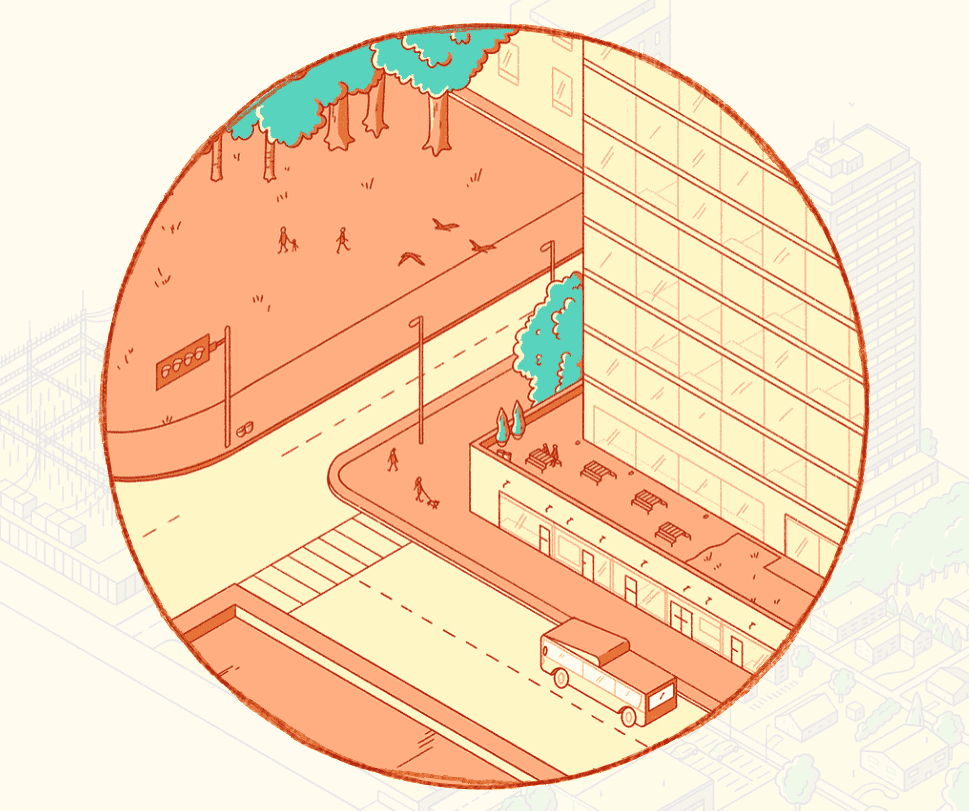
The story revolved around four isometric "tiles", each highlighting a different part of the story and together forming a cohesive isometric landscape. As you scroll through the page, you move around the landscape and zoom in on different elements highlighted in the report: electricity, buildings and flooding, and roads and railways. It was a fine balance between using the numbers from the research results to highlight the importance of investing in resilient infrastructure, and keeping the nuances of the topic at hand. (You can take a behind-the-scenes look and learn more about how we developed this story in this blog post.)
We used CSS to handle the panning and zooming, with enter-view as our scroll handler and Svelte as our JavaScript framework.